Customer and Product Analysis of Model Car Company in SQL
I analyzed sale records from a model car company to help improve product offerings and retain customers.

The following SQL code was written by me, Clay Whipp. It was done as part of a guided project through Dataquest, an online learning website. The code for the project can be found here.
In this project I looked at data from a sales records database for a company that sells scale model cars. There were 3 main questions I was looking to answer to help the company improve their sales:
- Which products should the company order more or less of?
- How should they tailor communication strategies to customer behaviors?
- How much can they spend on acquiring new customers?
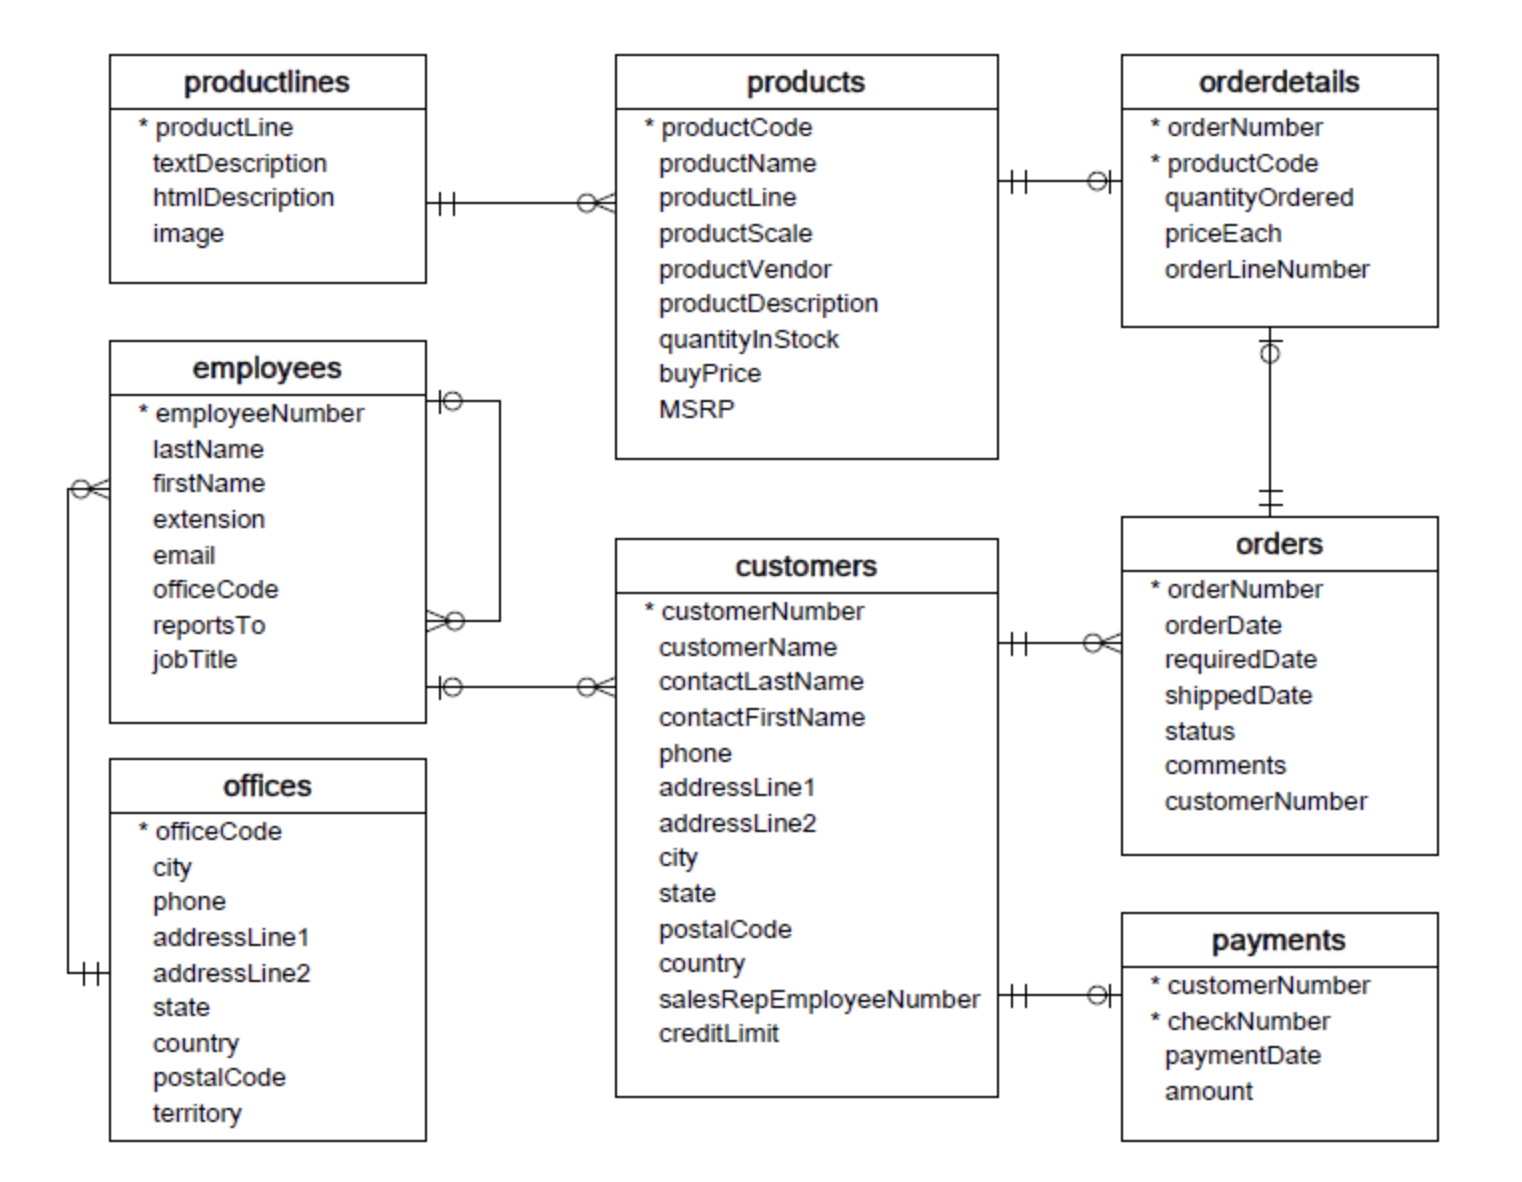
The schema for the database is shown below:
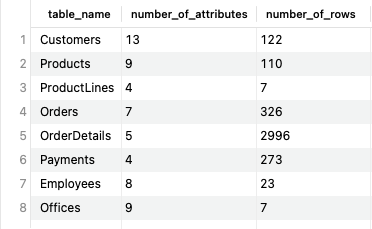
In order to better understand the size of the data, I queried the number of attributes, number of rows for each table in the dataset and put them into a new table.
Next, I answered the first question: Which products should the company order more or less of? This will help the company not to run out of stock of the best selling products, and not to order too much of the products with lower sales. To answer this question, I calculated qualities I called demand ratio and product performance where
Demand ratio = SUM(quantityOrdered) / quantityInStock
Product performance = SUM(quantityOrdered * priceEach)
These attributes can be found in the products, and orderdetails tables. I found the products with top 10 and bottom 10 demand ratios. The company should order more of the products with a high demand ratio, since they are ordered more by customers and in stock less, and order less of the products with a low demand ratio. Here is the result of the queries I wrote:
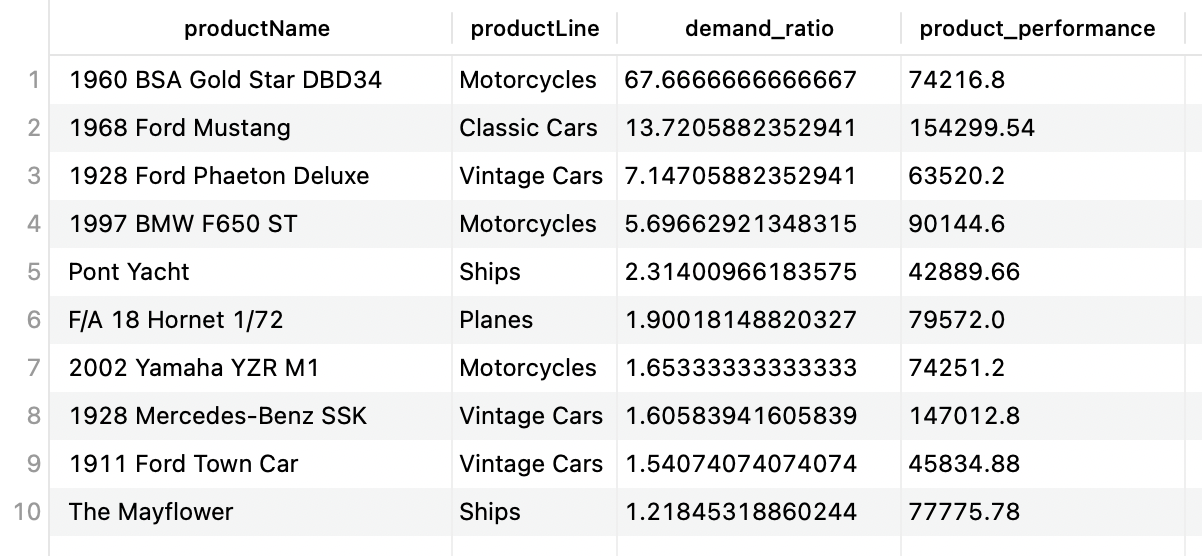
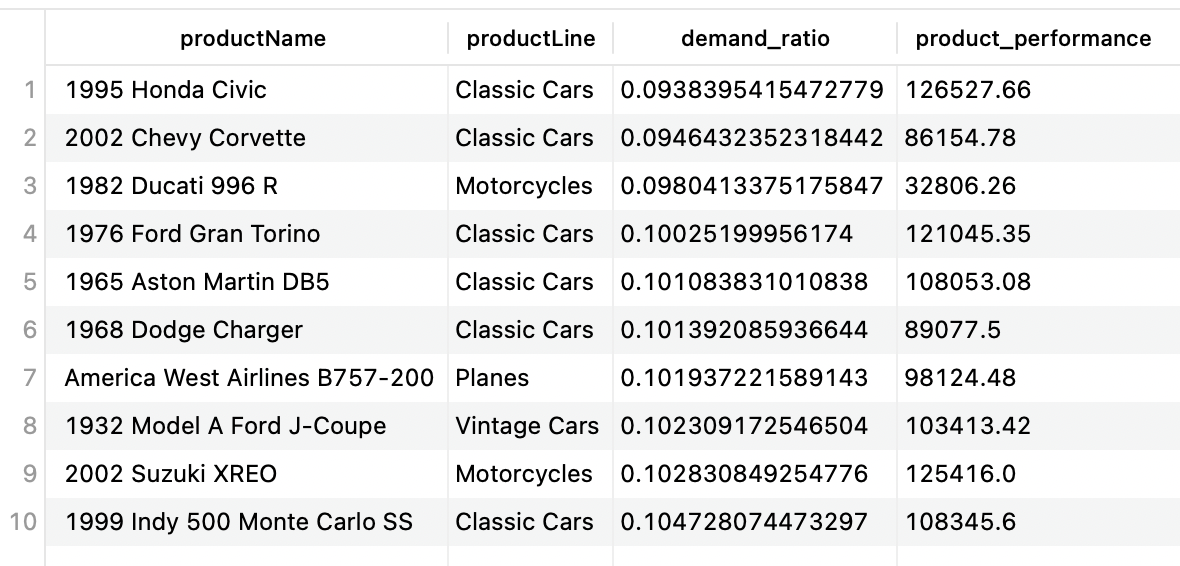
7 out of 10 of the products with the lowest demand ratios are classic or vintage cars. The 1960 BSA Gold Star has by far the highest demand ratio at 67.6. The 1968 Ford Mustang has the second highest demand ratio at 13.7, and has a product performance of $154,299 which is over twice as much as the BSA Gold Star. Thus, the company should order less of certain vintage cars like the 1995 Honda Civic, but more of others like the 1968 Ford Mustang.
Next, I answered the second question: How should the company tailor communication strategies to customer behaviors?
I answered this question by finding the top 10 VIP customers, defined as customers who generate the most profit, and least-engaged customers, defined as the customers who generate the least profit. Profit was calculated using the following formula: SUM((priceEach - buyPrice) * quantityOrdered). Here is the result of my queries:

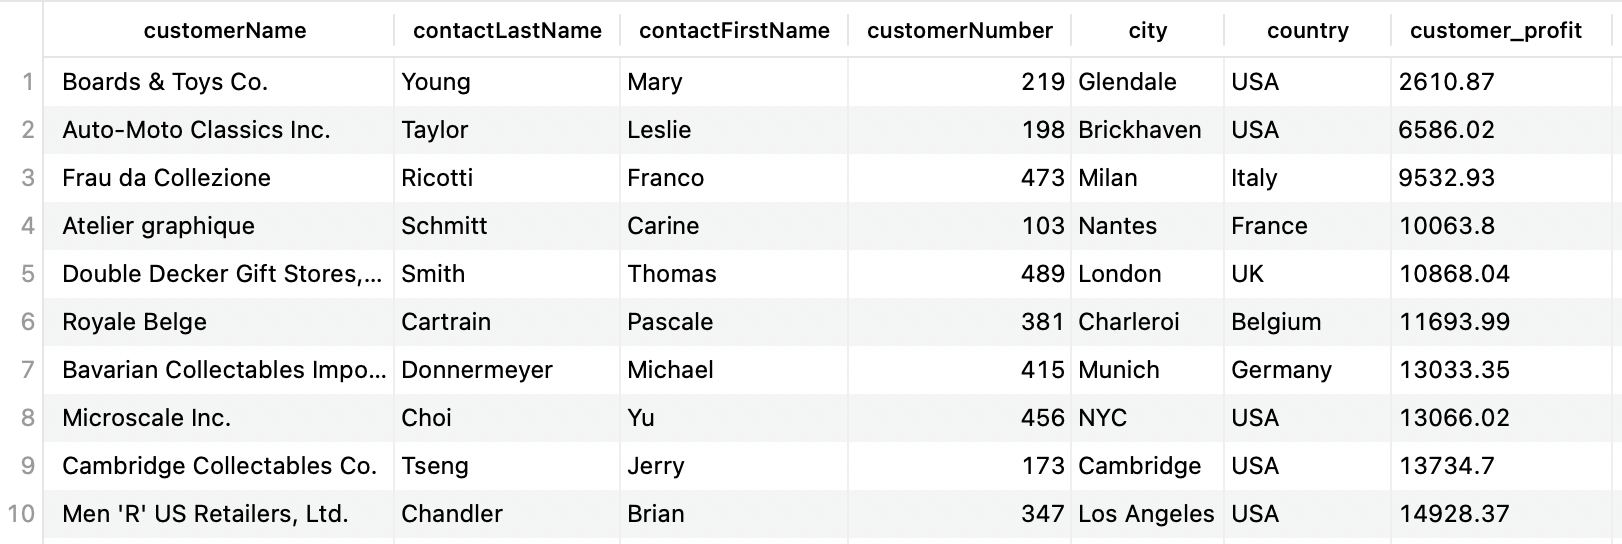
Now that the company knows who are their best customers and not as great customers are, they can tailor communication to each of them accordingly. For example, they could offer a loyalty program to retain the VIP customers, and offer coupons to the less-engaged customers to entice them to shopping more frequently with the company.
Finally, I answered the third question: How much can the company spend on acquiring new customers? Before, I answered this question, I found what percentage of customers each month were new to see if it was actually worth it to spend money acquiring new customers. This is the result of that query:
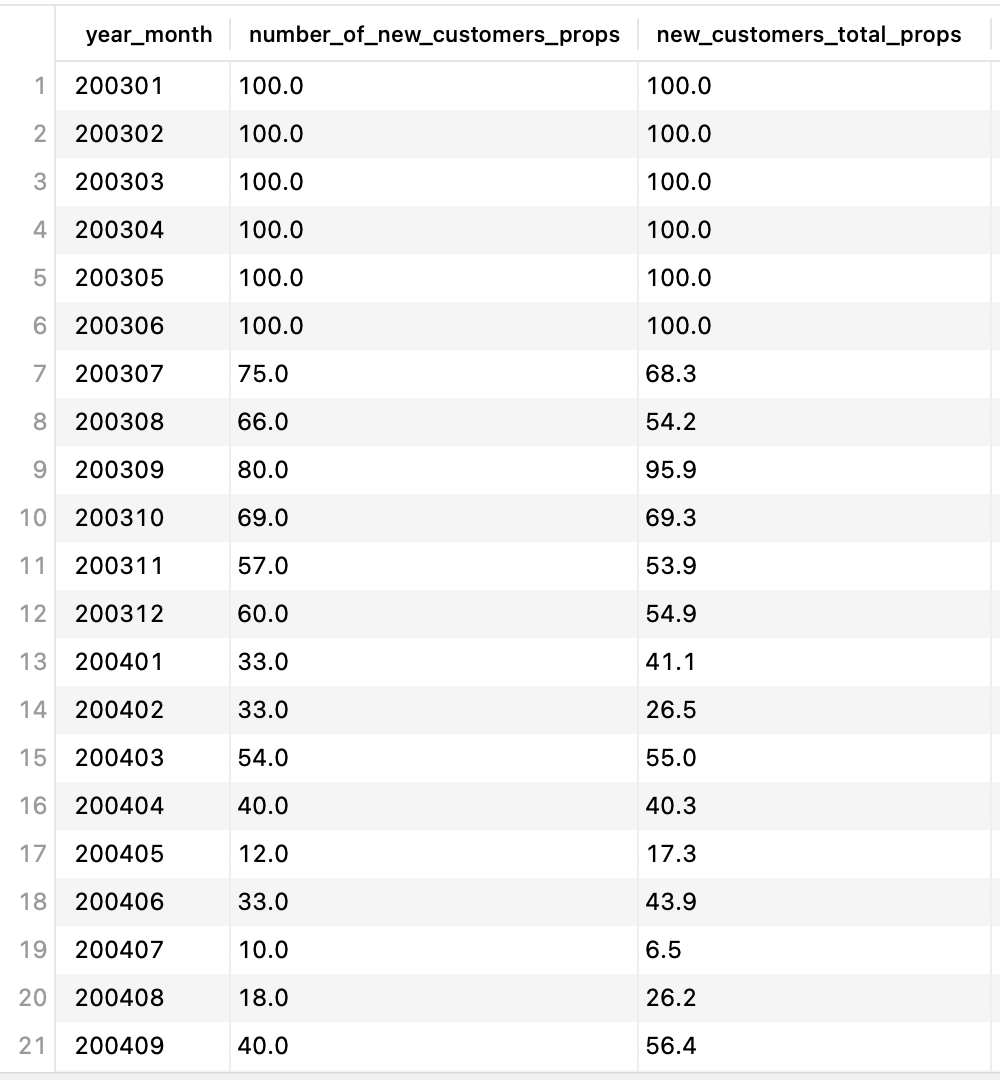
I found the percentage of new customers has been declining over time. This dataset also includes data from 2015. Since There are no records in the table after September 2014, this means the company hasn't had any new customers since 2014. This means it's critical that the company invests money into obtaining new customers.
To find how much money the company can spend on new customers, I calculated the Lifetime Value (LTV) of an average customer, which represents the total amount of money an average customer generates for the company. From the query I wrote, I found the LTV to be around $39,000. If the company wants to spend for example 10% of their revenue from customers on acquiring new customers and acquires 100 new customers next month, then they have a budget of $390,000 to spend.
To summarize, the actions I performed for this company are:
- Found the products with the highest and lowest demand, which helps the company determine which products they should order more and less of
- Found the customers that spend the most and least at the company, which helps them determine who they should target with which stategies to increase customer retention and increase customer spending
- Found the amount a total customers spends over their lifetime at the company, which helps the company determine how much they can spend on acquiring new customers.
This project helped me better understand how to use subqueries, common table expression, and joins in SQL.